Saturday, October 18, 2014

10/9/2014 Impulse Momentum Activity

Purpose:
This lab purpose is to find the objects impulse which is applied to an objects that equals the change in momentum of that object. To do this we will use two carts to measure the force impact and the velocity of the cart.

Experiment:
In this lab we set up a cart attached to a pole so we could use the spring it has inside the cart to measure impact with another cart which has a force sensor. So the moving cart will collide into the station cart with the spring and allows the initial cart to be pushed back after the collision. During the collision we measure the non constant force and the carts non constant velocity before during and after the impact. Here is a picture of the experiment.


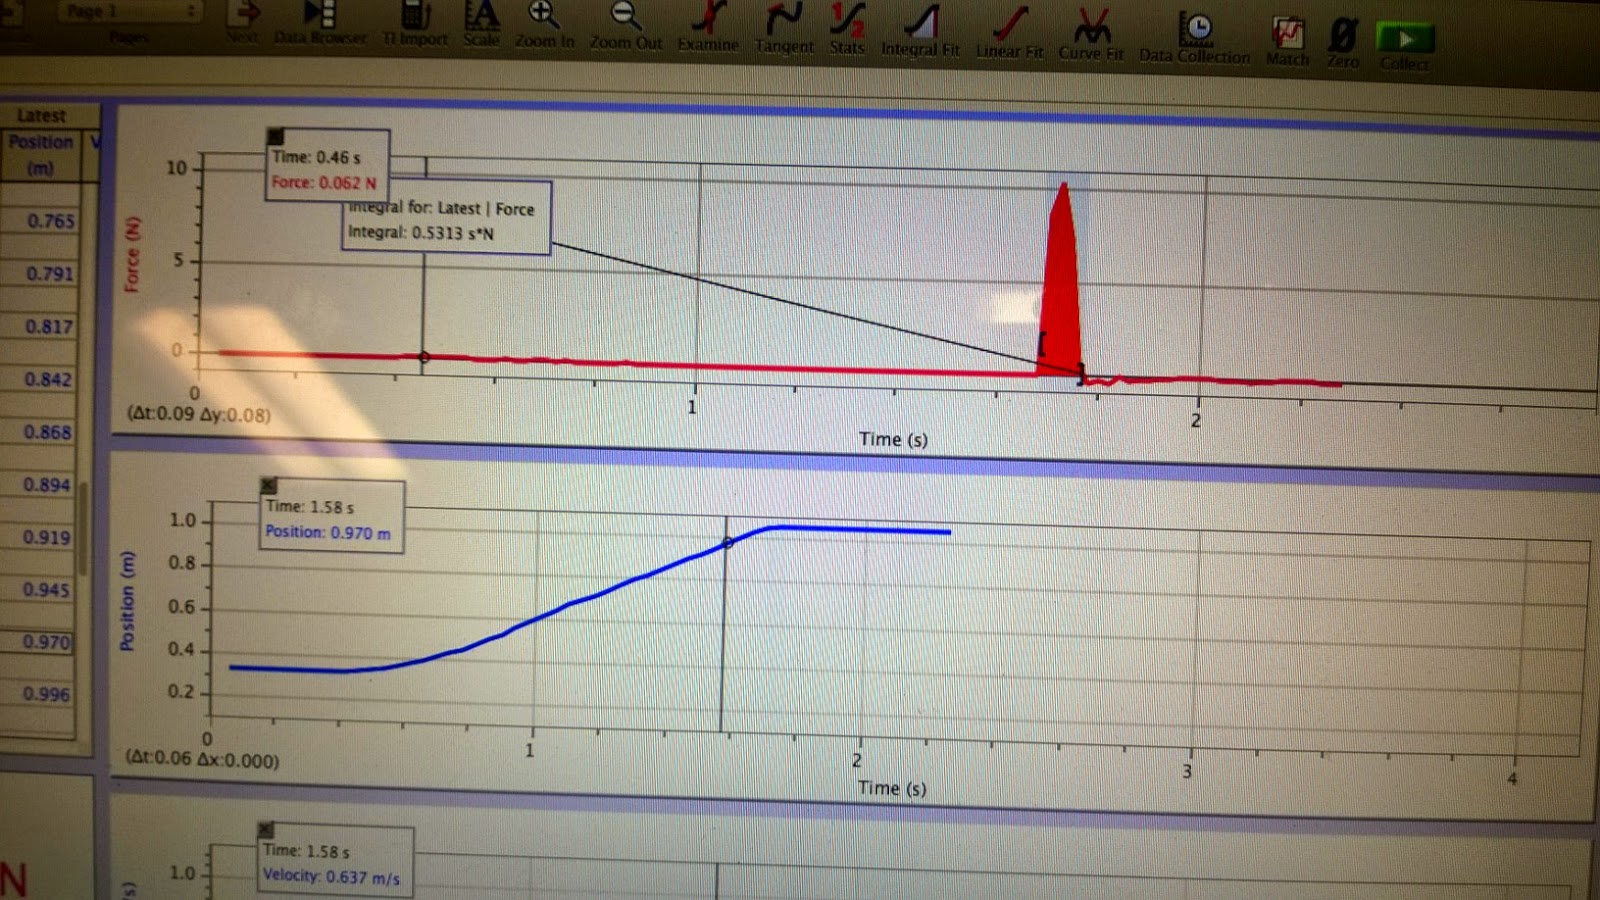
Here is the data of the force, position, and velocity of the moving cart which is the blue cart in the picture being pushed and bouncing back. Are force sensor is reading a negative force in this picture, but we reverse the sensor and repeated the experiment. As you can see the collision is less than 1/5th of a second.

Now that we have the data collected we can calculate the impulse of the carts collision by taking the integral of the change in Force respect to time from begging of collision to the end(momentum). We repeated the experiment against with the force being positive then increased the mass of the car and did the experiment again. The integral of the momentum is simply the area under the graph as shown below.

M = 403 grams

With our own calculations we have:
m = 403 g
Vo = 0.48 m/s
Vf = -0.38

m(Vf - Vo) = Impulse
0.403(-0.38 - 0.48) =  -0.346

M = 803 grams


With our own calculations we have:
m = 803 g
Vo = 0.633 m/s
Vf = -0.5

m(Vf - Vo) = Impulse
0.803(-0.5 - 0.633) =  -0.907

Both experiments our signs where wrong but this is because we flipped the force sensor sign and not the position sign.

The next part of the impulse lab we used a clay block instead of a cart with a spring for the impact object. So now when the cart collide it will stick into the clay and not bounce back. Here our the graphs. You can see in the data collection the position does not change back and the velocity stops suddenly so the energy is not conserved. The integral Force respect of time to find the impulse of the impacts.

Mass 403 grams


Mass 803 grams

Wednesday, October 15, 2014

10/9/2014 Unknown magnet energy.

Purpose:
The purpose of this lab is to find some kind of energy relation from a magnet which does not fit hooks law for potential and kinetic energy. To do this we will have to measure the force vs distance to find the work and then get an equation to test if energy is conserved.

Experiment:
The experiment was setup with a slider which is on an air table to create a frictionless surface for it to move on. One of the problems was making sure the table was level enough so the slider wouldn't stop because of the slope of the table. After we had the table at a reasonable level we tested the slider by pushing it into the side of the table with the magnet which would repel the magnet on the glider back to its original starting point. Here is a picture of the setup:


Next we put the air table on a slope so the glider would slide into the magnet and we calculated the angle of the slope. Then we would measure the separation distance from the magnet. Now with the weight of the glider  and the angle we could find the force with equation:

mgh * cos(x)   =  ma = Force   *x is the angle

Here is the table at the angle:


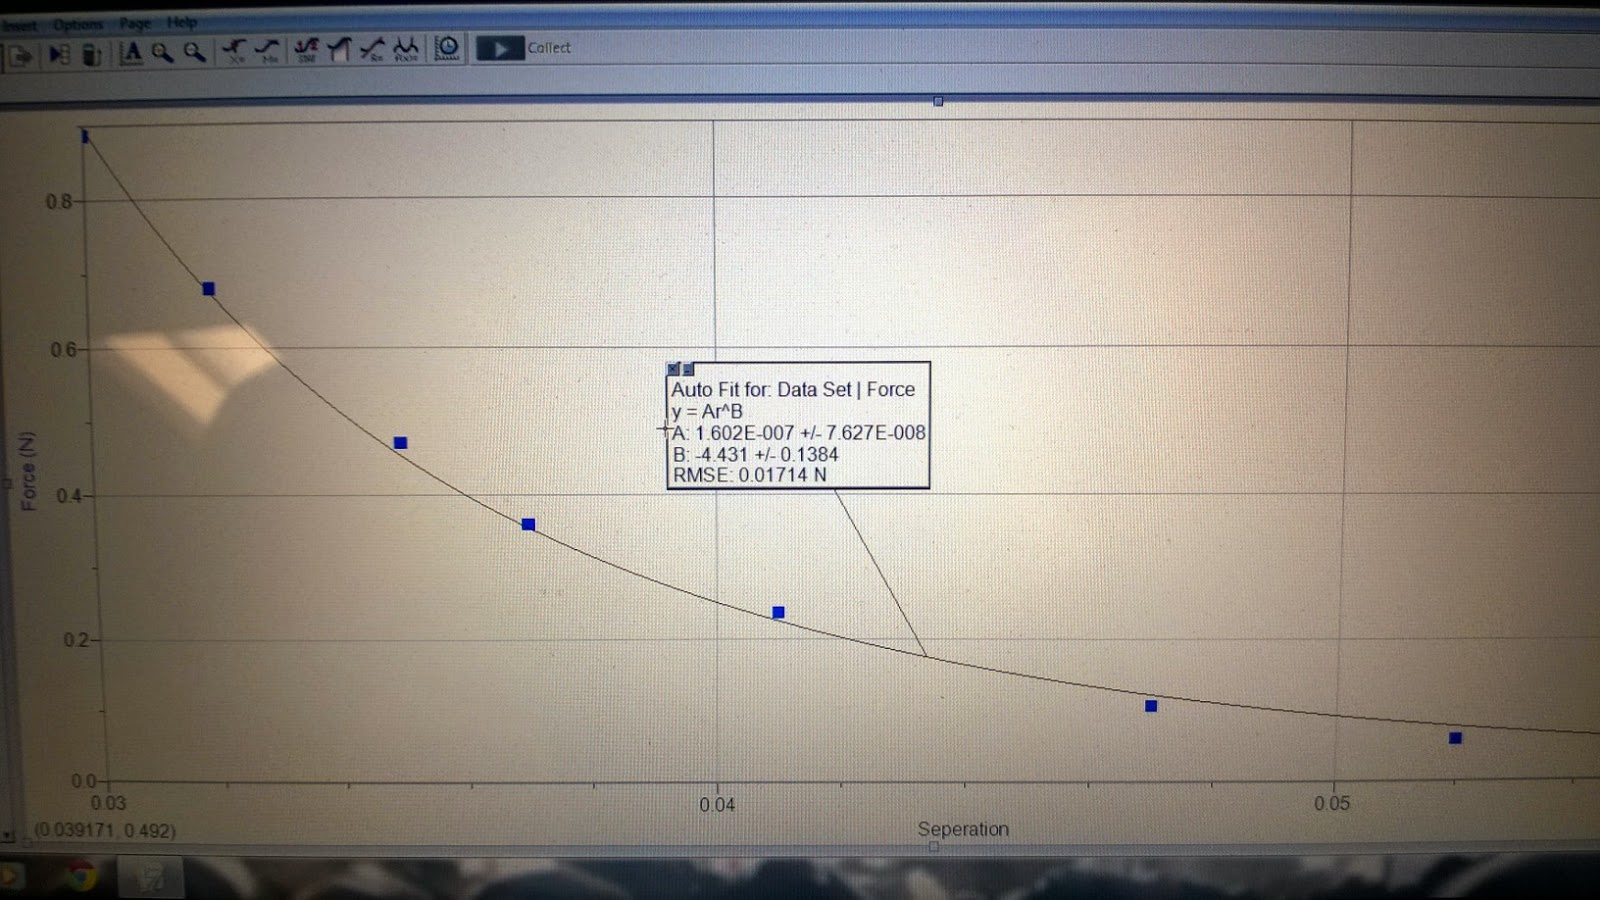
We did this five more times increasing the angle and measure the angle and distance so would could graph the force vs the distance. With this graph we put a non linear fit for the computer to find the values of A and B so we could create an equation for the relationship of the magnets energy.


Now we took the information from the force vs distance graph and derived out formula which we will use to calculate the energy of the magnet. 

Next we leveled our table and pushed the glider into the magnet again but this time measure with our motion sensor so we can measure velocity, position, and time.

We setup up another graph to graph potential energy, kinetic energy and total energy. Where potential energy is from the magnet.

Here is our final graph:

The final graph show the kinetic energy in purple is conserved with the potential energy of the magnet.


Sunday, October 12, 2014

10/7/2014 Conservation of Energy

Purpose:

The purpose of this lab is show the the conservation of energy. To do this we will need to measure the kinetic energy of the mass, kinetic energy of the spring, potential energy of the mass, potential energy of the spring, the elastic energy of in the spring, gravitational potential energy of the spring, and finally the total of all the energy.

Experiment:

To show the conservation of energy we will be using a mass attached to a spring. We will measure the springs natural length and the then measure the springs stretch to find the springs constant coefficient by using the formula mg = kx.

Now we use our motion sensor which is position on the floor to measure the distance the mass will oscillate up and down on the spring. We bring the mass to the springs natural length and let logger pro measure our time and distance which gives us velocity.

Here is a picture of the experiment setup:


Now that we have all our data collected from our motion sensor we had to calculate the six forms of energy we need to get the total energy on the system.

Here are the formulas we used to created calculated tables for each type of energy.

KE of mass : 1/2mv^2
PE of mass:   mg * y
Elastic PE in spring: 1/2 K (stretch)^2
PE of spring: m(spring) / 2 * g * y + mgh/2  *h  = height of top of spring and y = bottom of spring
KE of spring 1/2 m(spring)/3 * V^2(mass)
GPE: 1/2 m(spring) * g * y (y = bottom of mass height)

Then we where able to calculate the total energy in the system and graphed all this data on logger pro vs time.


At this point we realized the way we collected the data was wrong because we zero our motion sensors at the position of reset and reversed the position sensor so our distance would be positive going down. So we had to ask the professor for help to change our distance readings and we where  calculate our data properly as shown in the graph below the top line is the conservation of of potential and kinetic energy in the system which creates an almost straight line.


Saturday, October 4, 2014

10/2/2014 Work-Energy Theorem

Purpose:
Today we looked at the Work-Energy Theorem which is the work is equal to the total kinetic energy.

Experiment:
We are going to attempt to show this relationship in our lab by taking a spring attached to a rolling cart  and attached to force sensor on the other side of the spring and start the car at rest to zero the distance of our motion detector. We also had to make sure our force sensor was zeroed and was measuring close to a known mass. So now we have a cart attached to a spring at rest pointing to location zero. We then stretch the spring out and hold the cart in position and tell our motion sensor that towards the resting position which is zero is our positive axis. So the cart is pulled away from the resting position show an increase of distance not a negative distance. We pull the cart back again turn on the sensor to collect data and let the cart go.

Here is a picture of our setup.


Calculations:
 Now we have all the data collected into our logger pro program from our motion sensor and force sensor we have force, time, position, and velocity, so all we need now is the Kinetic Energy which we add a calculated variable into logger pro using the formula KE = (mv^2)/2. Which our kinetic energy now calculated we plot a graph with kinetic force vs position and also plot a separate graph on the same graph for kinetic energy. We then select a portion of our graph for force vs position to get the area by using the integral of the selected portion of our graph which should give us the the same kinetic energy for the same time. It is no perfect but we feel our data is has a reasonable error.

Results:
Here is our graph red is force vs position and purple is kinetic energy. You can also see our integral compared to the kinetic energy for that time.

Friday, September 26, 2014

9/25/2014 Work and Energy

Purpose:
The purpose of this lab was to get physic students some needed sunshine. So we went out side to calculate the amount of work we use to walk up a flight of stairs and how much work we use to pull an object up the same distance. We will also calculate the power as well.

Experiment:
First thing we did in this lab is measure the height of one step. Then we counted the number of steps total. With the height of the steps and the number of steps we could calculate the height we would travel up the stairs.Then we had to walk up the stairs and time how long it took us to reach the top of the stairs. That was the first part of our experiment for data for work it will take to climb the stairs. Then the next part of the lab we bags with weights in them which we would hang on a pulley over a railing. One of our team members would time the other while they pull the bag up the same height as the stairs.

Here is a picture of the class out side performing collecting data for our experiments.


After all the data was collected when went back inside to calculate our results. First thing we did was take our known weight and convert it into kg. My weight converted into kg was 95kg. Then with this I plugged in the data to the formula for work which is work = force * distance. This formula will give the results for the bad and walking up the stairs.

4.29 m is the distance to the top of the balcony floor in the picture.

Stairs:
Work:
(95kg) (9,8m/s^2)(4.29m) = 3993.99 joules
Power:
work / 8.48 second = 251.19 watts

Bag on pulley:
(5kg)(9,8m/s^2)(4.29m) =  210.21 joules
Power:
work / 8.48 seconds = 24.78 watts

The amount of work or power to bring a bag up the stairs would be much easier using the pulley system, To burn calories the stairs is a better choice.

9/23/2014 Relationship of angular velocity and the angle of a conical pendulum

Purpose:
The purpose of this lab is to find a relation between angular velocity of a conical pendulum and the angle which the conical pendulum makes with is string and the ground.

Experiment:
To accomplish this lab we had a very large conical pendulum hooked up to a power source so our rotations where almost uniform. The first data we collected was the measurements of the concial pendulum which included the height, radius of the stick which spun around, the length of the string which held the weight, and later we measure the height on which the weight was above the ground during it rotations. Next we would calculate the period on which the pendulum was moving by timing a couple of rotations and finding the average of this time for one rotation. We repeated the task of increaseing the angular speed and find the the height of the weight from the ground during its rotation and the period of rotation for seven data collections.

Here is a picture of the setup:


Next we had to create a formula that is our predicton for the relationship betwewen the angle between the ground and the string with the angular velcotity. Here is our formula for the model of angular velocity and the the angle between the gournd and the wire. Here is the forumula.

Now with the height on which the weight would hit during its rotations we could use trigonometry to find the angle created with the ground in string. With this data we plugged in a table of possible useful data we would need to prove our relationship is correct shown below is our data table.

Now with this data was much more then we needed, but we decided to show our formula is correct by comparing it the formula of w = 2PI / T. We made a graph of our model for the model w = 2PI / T.
Even though our graph is not that great I think our model is still right and our collection of time is what make our data bad. The slope of this graph should be very close to one which our is and isn't.


Update: I re did the formula which is shown above and I realized our original formula was the one crossed out which is wrong. Which explains why our graph is so bad.

9/23/2014 Angular velocity and its relation with angular acceleration

Purpose:
The purpose of this lab was to use an accelerometer on a spinning table to some how show the relation ship between angular acceleration and angular velocity.

Experiment:
We first used the accelerometer to calculate the average acceleration of the sensor as it spun in a circle. As we found the acceleration we also timed the amount it would take for the table to spin two or 4 rotation and calculated the average time it one period or full rotation took. With the angular acceleration we can calculate the time of a rotation manually and with that data we will be able to find it angular velocity.

Here is a picture of the spinning table with the accelerometer:


Here is a picture of the raw data collected for time and angular acceleration:


Now we can use the formula w = 2PI / T to find angular velocity. Then with that data we can plug our data into logger pro and graph angular acceleration vs angular velocity squared to what I assume is radius in the equation a = rw^2 which should produce a linear graph of because the radius of the spinning table is constant which also show the relation between angular acceleration and angular velocity.

Here is the graph of the data: